

Today, a year ago we left Santiago and started our life in Maria Pinto. For the first 6 months we were fortunate enough to rent a small house in another sector of the valley about 10km from our property. Cecilia, the owner, soon became a very close friend, and it was so helpful to be “nearby” throughout the whole building process and not commuting from Santiago every day.
Over the next few days we will also celebrate other “anniversaries”, on the 8th we broke ground and on the 10th we will have been living in our house for 6 months. So much to celebrate and so much to be grateful for, especially during such crazy health and economic crises.
Another month has passed and we have been monitoring temperature and energy consumption as we did in May (see post here). Winter has definitely set in, with some very cold and frosty mornings, but thankfully June surprised everyone as it has turned into the wettest month in the Metropolitan Region in 15 years. We bought a rain gauge a few months ago, with little hope of it being used a lot as the central zone of Chile has been experiencing a severe 10 year-long drought. But it has been put to good use and in June we received 150,5mm! And today while writing this blog it has been pouring again and we have had at least another 40mm.
Temperature monitoring
We continued to record daily temperatures, at about 7:30am, and you can see from the graph below that the outside temperature at that time of the day was really varied over the month, from as low as -0,7°C to almost 13°C. On the other hand, the interior temperature in the living room only varied about 4 degrees from a minimum of 18,7°C to 23°C. It is incredibly satisfying to have such a stable environment in the house every morning.
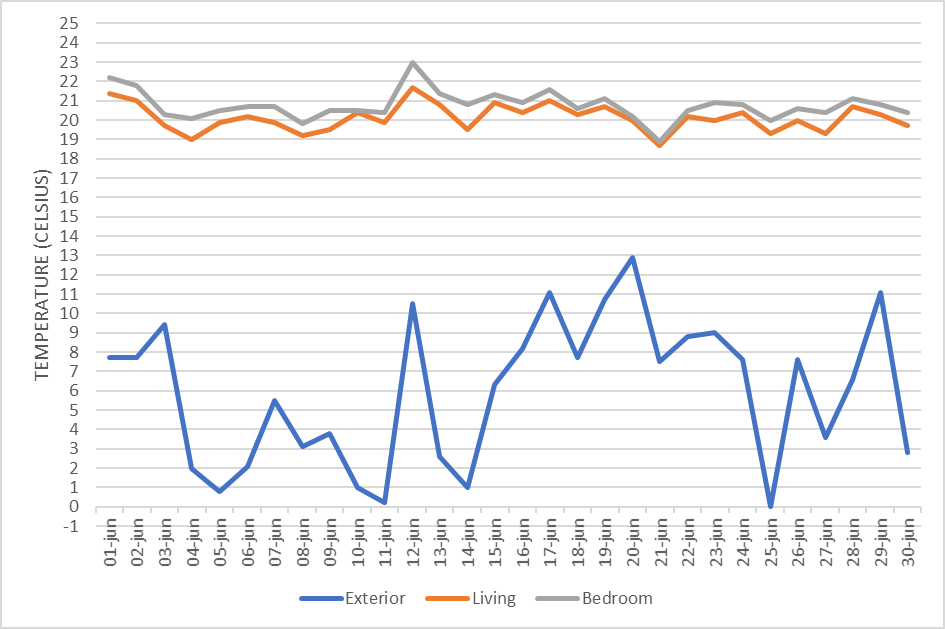
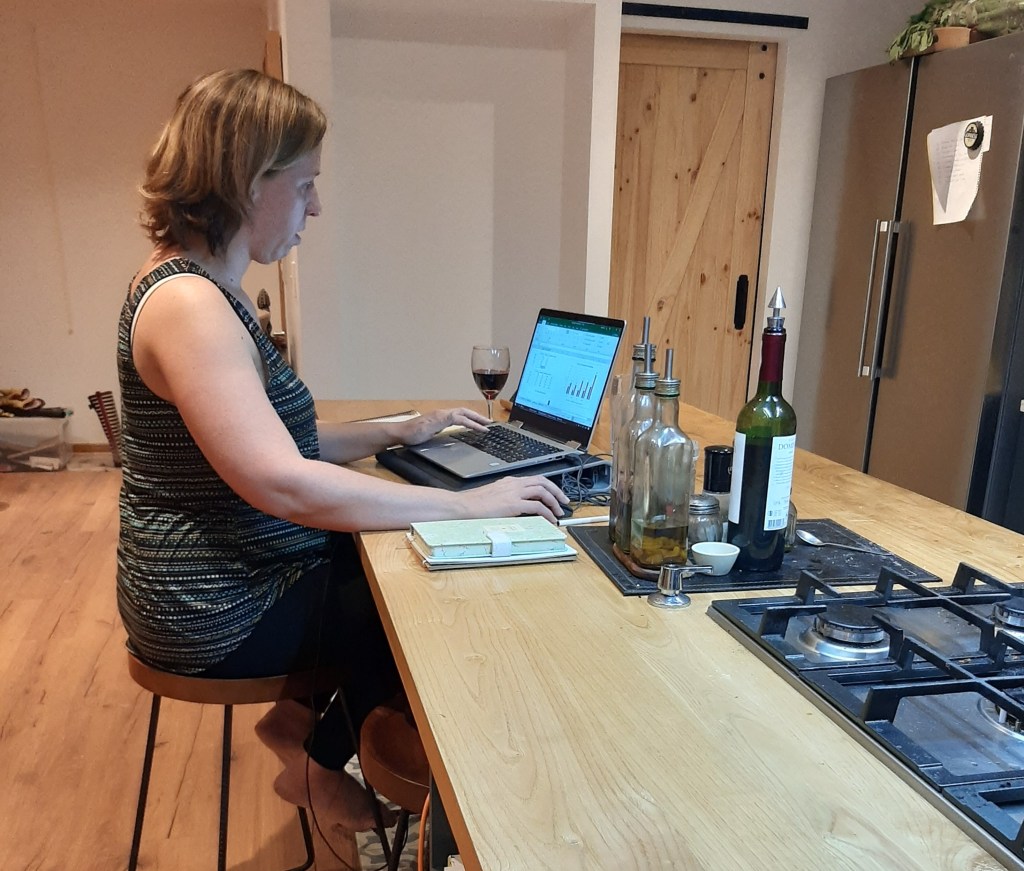
Although this graph only registers one specific moment in the day, the temperature inside the house has fluctuated between about 20 and 25 degrees throughout the day. One of the advantages of COVID-19 and working permanently from home is that we have been able to observe how the house has behaved throughout the day and in all conditions, sunny, overcast, misty, raining etc. But more than just share numbers in this post, a picture speaks a thousand words…
Energy consumption
Apart from temperature monitoring, it is important for us to monitor how much energy we use to heat and cool our home. During May we did not have to use the underfloor heating system at all, however in June, with icy mornings and overcast days we turned on the heat 17 out of 30 days and for a total of about 20% of the time in the entire month.
Rodrigo would turn on the system before going to bed when we knew that the minimum temperature was going to be very low the next morning and when the house had not managed to accumulate a lot of heat during the day. The system is designed to be in standby mode measuring the temperature of the water returning from the underfloor pipes until it drops to 21°C. The system is then activated and the heat pump starts working. We have set the system to inject water at a temperature of 32°C, which means that the return water temperature will be 27°C. The difference between the injected and return temperatures shows that heat is being transferred to the floor and the house is being heated. This setting allows us to maintain the house with a temperature of approximately 20,5 degrees. Super comfortable and not even necessary to have a jersey on (for most people).
Just to give you a general reference, underfloor heating systems in standard houses will usually inject water at a temperature of between 45 and 50 degrees. This shows that we are able to heat our house at a lower temperature and hence it is more efficient in terms of energy consumption.
Rodrigo has explained to me how underfloor heating systems work in a much more technical way, but the general take home message is that so far the system has worked well for us on the mornings when we needed an extra boost of heat to maintain the temperature above 18/19 degrees and all while being extremely efficient.
So how much energy did we use in June? We used 75% more electricity than in May, with a total consumption of 235 kw/hr. The increase is a result of the underfloor heating system and the need to use the heat pump for hot water as the overcast weather reduces the functioning of the solar hot water system.
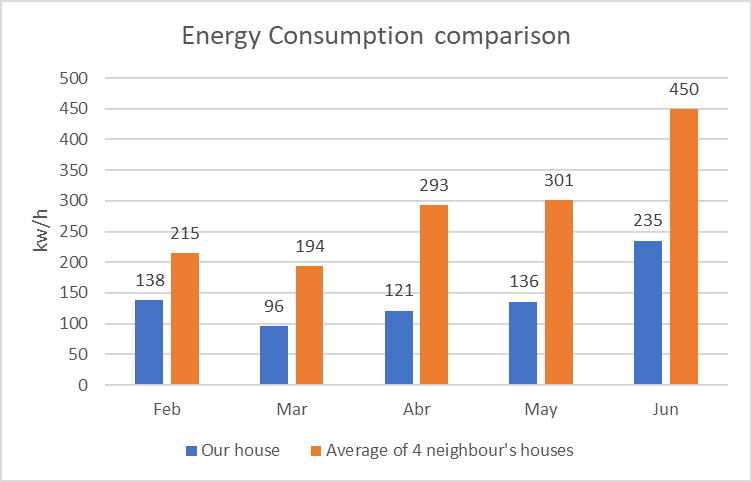
As in May, in order to provide our readers with a benchmark to see just how efficient our house is, we compared it to the energy consumption of 4 of our neighbours who have houses of similar sizes to us (around 120-140m2), similar materials (wood) and similar occupancies (2-3 people). As you can see in the graph, the average energy use is around 90% more than ours.
So, as you can imagine, we are very happy with how the house is behaving and the level of comfort we have every day, all day. I honestly look back on winters in South Africa and Santiago and think how crazy it is that we have to put up with such cold temperatures in our homes.
And now we are off to toast our first year of being Maria Pintanos!
Cheers to everyone who has supported us every step of the way over the last year!
P.s. this post was written on Saturday 4 July, but could only be published on Tuesday 7th due to internet connectivity problems in the valley.
